


肺炎支原体肺炎(Mycoplasma pneumoniae pne-umonia,MPP)是儿童常见社区获得性肺炎。近两年,伴随着新型冠状病毒感染(COVID-19)大流行的结束,MPP的患病率和门诊患儿中耐药肺炎支原体分离株的比例从最初的较低水平,到现在已经出现反弹的趋势[1]。门诊患儿的大规模增加使得临床医师要对疾病的诊断和严重程度进行快速地识别。研究表明,随着大环内酯类药物的耐药的发展,重症肺炎支原体肺炎(severe Mycoplasma pneumoniae pneumonia,SMPP)的发病率也在逐年攀升,而SMPP患儿容易合并多种肺外并发症,更容易出现多器官功能障碍综合征,从而危及患儿生命[1-2]。因此,临床医师需要寻找更多的诊断和分类诊断方法,避免对疾病的误诊和对疾病严重程度的误判,从而减少药物滥用和耐药的发生。既往的研究显示,中性粒细胞可以通过形成中性粒细胞胞外诱捕网(neutrophil extracellular traps,NETs)的方式参与机体的抗菌机制,但越来越多的研究结果表明这种机制在参与抗菌的同时还可能参与机体多项炎症反应,在多种感染性和自身免疫性疾病甚至肿瘤转移中发挥重要作用[3-4]。因此,本研究拟通过检测MPP、SMPP 患儿血清及SMPP患儿肺泡灌洗液(bronchoalveolar lavage fluid,BALF)中NETs,探讨NETs与儿童MPP病情严重程度的关系,以期为临床疾病监测提供一定参考依据。
1 对象与方法
1.1 研究对象
选择2023年10月至12月在兰州大学第二医院住院的MPP患儿为研究对象,分为非重症组(MPP组,n = 45)和重症组(SMPP组,n = 39)。MPP组未采集BALF标本;SMPP组采集到BALF标本共12例,且影像学检查表现为单侧肺受累,收集其患侧肺和健侧肺的BALF标本。本研究方案经兰州大学第二医院医学伦理委员会批准(批件号:2023A-440),入组患儿监护人均已签署知情同意书。
1.2 病例纳入及排除标准
纳入标准:①0~14岁;②符合MPP和SMPP诊断标准(参照《儿童肺炎支原体肺炎诊治专家共识(2023年版)》);③病程在14 d以内;④血培养或痰培养结果阴性、无明确病毒感染证据者[5]。排除标准:①有支气管哮喘和慢性阻塞性肺疾病等病史的患儿;②有血液系统疾病、严重先天性心脏病、严重肝肾功能不全、先天性支气管肺发育不良、遗传代谢性疾病、免疫缺陷疾病等严重基础疾病的患儿;③长期使用糖皮质激素或免疫功能调节剂、免疫抑制剂治疗的患儿。
1.3 方法
1.3.1 临床资料收集及血液、BALF标本采集
记录入组患儿的性别、年龄。于患儿入院后次日清晨采集空腹静脉血2 mL,在4 ℃以3 000转/分离心10 min后,分离血清于-80 ℃冰箱保存备检。按照文献[6]的技术要求,根据先健侧后患侧的原则行支气管肺泡灌洗,并收集BALF各5 mL;健侧选择右肺中叶或左上叶舌段,患侧选择病变段,总回收率≥30%,红细胞比例低于 20%,且无大气道分泌物混入为合格标本;将新鲜BALF移取至15 mL锥形离心管中,在相同条件下离心后,分离上清液置于-80 ℃冰箱保存备检。
1.3.2 标本检测
采用全自动血细胞分析仪检测血常规和C-反应蛋白(C-reactive protein,CRP),记录白细胞计数、中性粒细胞比例、CRP质量浓度;全自动乳胶凝集免疫比浊法检测D-二聚体,记录其质量浓度;ELISA法检测乳酸脱氢酶(lactate dehydrogenase,LDH),记录其水平。采用ELISA检测血清及BALF中NETs的含量,试剂盒购自上海酶联生物科技有限公司,具体操作步骤严格按试剂盒说明书进行,检测仪器为赛默飞世尔Mulltiskan FC酶标仪,在450 nm波长处依序测量各孔NETs的吸光度并记录。
1.4 样本量估计
根据文献预计儿童社区获得性肺炎非重症组和重症组的NETs与细胞游离DNA比值的均值分别为228、286,标准差分别为40、52[7]。要求双侧检验水准为0.05,把握度(检验效能)为90%。利用G*Power 15软件计算得到每组至少需要纳入12例患儿。
1.5 统计学处理
采用SPSS 26.0和GraphPad Prism 8.0进行统计学分析。正态分布的计量资料以$\bar{x}±s$表示,2组间比较采用独立样本t检验,血清与BALF组内对比采用配对t检验;非正态分布的计量资料以M(P25,P75)表示,组间比较采用Wilcoxon秩和检验;计数资料以n(%)表示,组间比较采用χ 2检验;SMPP组BALF与血清NETs的关系采用Pearson相关性分析。结合单因素分析结果筛选出具有统计学意义的指标,进行多因素Logistic回归分析(逐步法)。采用GraphPad Prism 8.0绘制受试者操作特征(receiver operating characteristic,ROC)曲线分析血清中NETs质量浓度以及联合外周血常规指标在SMPP诊断预测中的价值,并用DeLong检验比较各ROC曲线的预测性能。双侧P < 0.05为差异有统计学意义。
2 结果
2.1 MPP组和SMPP组患儿的一般人口学资料及实验室指标比较
MPP 组、SMPP 组患儿的年龄、性别比较差异均无统计学意义(P均> 0.05),但SMPP组的白细胞计数、中性粒细胞比例、CRP质量浓度、D-二聚体质量浓度、LDH水平均高于MPP组(P均< 0.05)。见表1。
表1 MPP组和SMPP组患儿的一般人口学资料及实验室指标比较Table 1 Comparison of general demographic data and laboratory indicators in children between the MPP and SMPP groups |
| 项 目 | MPP组(n=45) | SMPP组(n=39) | χ 2/t/Z值 | P值 |
|---|---|---|---|---|
| 性别(男/女)/n | 21/24 | 20/19 | 0.18 | 0.670 |
| 年龄/岁 | 6.02±3.00 | 6.38±2.75 | -0.57 | 0.570 |
| 白细胞/(×109/L) | 7.91±2.55 | 11.33±5.53 | -3.54 | <0.001 |
| 中性粒细胞/% | 62(55,69) | 72(66,76) | -4.23 | <0.001 |
| CRP/(mg/L) | 9.16(4.49,12.97) | 27.97(15.68,50.34) | -6.00 | <0.001 |
| D-二聚体/(mg/L) | 0.55(0.36,0.75) | 1.17(0.68,2.91) | -4.75 | <0.001 |
| LDH/(U/L) | 300.69±68.95 | 369.67±119.86 | -3.17 | 0.002 |
2.2 NETs质量浓度在MPP组与SMPP组血清中的比较及在SMPP患儿健侧肺、患侧肺BALF中的比较
SMPP组血清NETs质量浓度高于MPP组(t =82.00,P < 0.001);SMPP组患侧肺BALF的NETs质量浓度高于健侧肺BALF(t = -2.79,P < 0.001)。见图1。
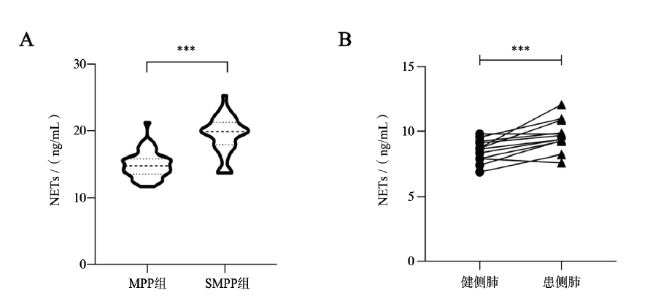
图1 NETs质量浓度在MPP组与SMPP组血清中及在SMPP患儿健侧肺、患侧肺BALF中的比较注:A为MPP组、SMPP组患儿血清NETs质量浓度比较;B为SMPP组患儿的健侧肺、患侧肺NETs质量浓度比较;***P < 0.001。 Figure 1 Comparison of NETs mass concentrations in serum between the MPP group, SMPP group and those in BALF between the healthy lung and affected lung of children with SMPP |
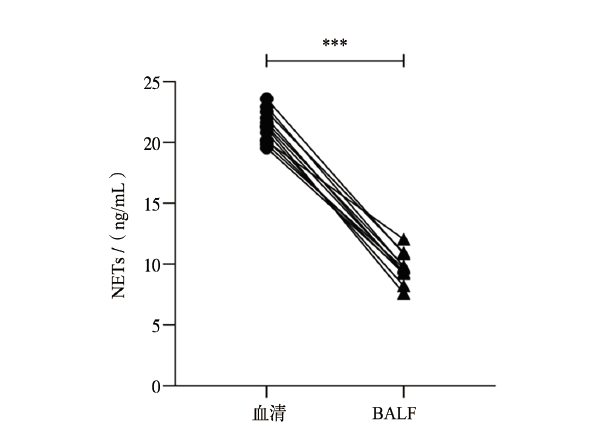
2.3 SMPP组患儿BALF与血清中的NETs质量浓度差异及相关性分析
SMPP组患儿血清中NETs质量浓度高于BALF中NETs质量浓度(t = 25.546,P < 0.001);两者相关性弱(r = 0.192,P = 0.551)。见图2。
2.4 SMPP 影响因素的Logistic 回归分析
将白细胞计数、中性粒细胞比例、CRP质量浓度、D-二聚体质量浓度、LDH水平、血清NETs质量浓度的具体值纳入多因素Logistic回归分析(逐步法),结果显示CRP、LDH、血清NETs是SMPP的影响因素。利用三者建立Logistic 回归模型,得出回归方程为:Logit P = -21.103+0.155×CRP+0.014×LDH+0.863×NETs。对上述模型行似然比检验,具有统计学意义(χ 2 = 2 662.44,P < 0.001),对各回归系数的Wald χ 2检验显示,CRP、LDH、血清NETs的P均< 0.05。见表2。
表2 SMPP 影响因素的Logistic 回归分析Table 2 Logistic regression analysis of the influencing factors of SMPP |
| 指 标 | β | SE | Wald χ 2值 | P值 | OR | 95%CI |
|---|---|---|---|---|---|---|
| CRP | 0.155 | 0.063 | 6.030 | 0.014 | 1.168 | 1.032~1.321 |
| LDH | 0.014 | 0.006 | 5.284 | 0.022 | 1.014 | 1.002~1.026 |
| 血清NETs | 0.863 | 0.253 | 11.684 | 0.001 | 2.371 | 1.445~3.891 |
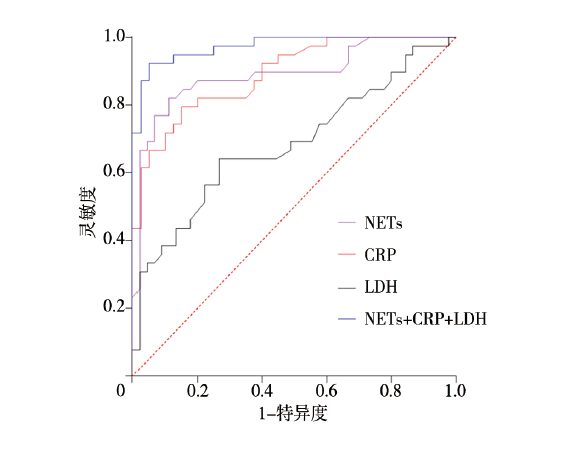
2.5 血清NETs质量浓度对SMPP的预测价值分析
表3 血清 NETs、CRP、LDH及三者联合预测 SMPP的 ROC 分析结果Table 3 ROC curve analysis results of serum NETs, CRP, LDH and their combined for prediction of SMPP |
| 指 标 | AUC | 95%CI | 截断值 | 约登指数 | 灵敏度 | 特异度 | P值 |
|---|---|---|---|---|---|---|---|
| 血清NETs | 0.892 | 0.810~0.963 | 17.24 | 0.696 | 0.821 | 0.875 | <0.001 |
| CRP | 0.892 | 0.712~0.907 | 15.10 | 0.645 | 0.795 | 0.850 | <0.001 |
| LDH | 0.684 | 0.567~0.800 | 318.00 | 0.374 | 0.641 | 0.733 | 0.010 |
| 血清NETs+CRP+LDH | 0.974 | 0.946~1.000 | 0.54 | 0.873 | 0.923 | 0.950 | <0.001 |
图3 血清 NETs、CRP、LDH及三者联合预测 SMPP 的 ROC 曲线Figure 3 ROC curves of serum NETs, CRP, LDH and their combined for prediction of SMPP |
表4 NETs、CRP、LDH及三者联合诊断的 ROC AUC比较Table 4 Comparison of ROC AUC of NETs, CRP, LDH and their combined for SMPP diagnosis |
| 诊断指标 | Z值 | P值 | AUC 差异 | 标准误 | 95% CI |
|---|---|---|---|---|---|
| 血清NETs vs. CRP | -0.103 | 0.918 | -0.005 | 0.272 | -0.109~0.098 |
| 血清NETs vs. LDH | 2.520 | 0.012 | 0.199 | 0.318 | 0.044~0.354 |
| 血清NETs vs. 联合 | -2.369 | 0.018 | -0.088 | 0.231 | -0.160~0.015 |
| CRP vs. LDH | 3.039 | 0.002 | 0.204 | 0.308 | 0.073~0.336 |
| CRP vs. 联合 | -2.663 | 0.008 | -0.082 | 0.220 | -0.143~0.022 |
| LDH vs. 联合 | -4.922 | <0.001 | -0.287 | 0.273 | -0.401~0.173 |
注: 联合指血清NETs、 CRP与LDH联合诊断。 |
3 讨论
MPP是一种具有自限性的传染性疾病,主要通过呼吸道传播,潜伏期通常为2~4周。该病全年活跃,有证据显示其可引起地方性流行,并在中国大部分地区每隔2~3年发生一次大规模流行[8]。肺炎支原体可引起上呼吸道和下呼吸道感染,大多数病例的临床症状是非特异性的[2]。虽然大多数MPP病例的病情并不严重,但有些病例可能发展为重症肺炎和难治性肺炎,伴有胸腔积液、多器官功能障碍综合征和严重的长期后遗症,包括闭塞性细支气管炎和支气管扩张;在严重情况下,SMPP患者可能会出现呼吸衰竭和低氧血症,需使用机械通气、体外膜肺氧合等技术进行生命支持,病情危重者甚至可能会死亡[6]。在SMPP高发生率的情况下,早期诊断和治疗显得尤为关键。
既往的研究表明,NETs在细菌、病毒、真菌早期感染过程中均具有一定积极作用,随着研究的深入,这些疾病的炎症进程中同样发现NETs的参与[9]。针对COVID-19患者肺泡和内皮损伤机制的研究表明,严重COVID-19 病例中IL-1β和NETs可能会形成前馈环直接激活和损伤内皮细胞,削弱内皮屏障完整性[10]。肺炎链球菌甚至可以通过促进中性粒细胞向NETs的转换,从而实现对中性粒细胞的免疫逃避[11]。铜绿假单胞菌作为下呼吸道感染常见致病菌之一,其慢性感染患者的痰液中也发现了NETs,并且NETs与痰液黏稠度的增加以及肺功能的下降相关[12]。NETs作为一种肺部炎症的促炎因子已被越来越多的研究者所认识,探究其在肺部感染性疾病中的作用可能为疾病的治疗提供新的思路。
本研究结果显示,SMPP组外周血中的多种因子水平以及血清NETs质量浓度均高于MPP组,提示 MPP患儿病情加重可能与上述因素有关,进一步的Logistic回归分析结果显示,NETs、CRP、LDH均为MPP患儿疾病进展的影响因素。NETs是中性粒细胞的一种特殊形式,是最早到达损伤部位的炎症因子,能同时调节先天性和适应性免疫反应,并具有较强的杀菌作用和促炎作用[13]。有研究表明,NETs可以激活浆细胞样树突状细胞(plasmacytoid dendritic cell,pDC),以一种依赖于DNA和Toll样受体9(toll like receptor 9,TLR9)的方式产生高水平的干扰素-α(interferon-α,IFN-α)[14]。NETs还可以通过调节核苷酸结合寡聚结构域样受体蛋白3(nucleotide-binding oligomerization domain-like receptor protein 3,NLRP3)的去泛素化修饰,激活肺泡巨噬细胞的焦亡过程,加重脓毒症引起的肺损伤[15]。本课题组之前发现,肺炎支原体可能通过pDC-TLR7/9-IFN-α和NLRP3/IL-1β、IL-18 通路参与SMPP的发病机制[16⇓-18]。因此,本研究旨在探究对NETs在SMPP中的作用,为SMPP发病机制的研究提供参考依据。
众所周知,MPP向SMPP转变最主要的特征就是炎症风暴的进一步发展,以及多种肺内及肺外并发症的发生。本研究显示,CRP、LDH是影响MPP患儿疾病进展的因素,这与2023年更新的新版MPP诊疗指南中提出的CRP和LDH对于疾病严重程度诊断具有价值一致[6]。D-二聚体是交联纤维蛋白的降解产物,与血液高凝及急性血栓密切相关[19]。但由于出现明显血栓的病例极少,临床缺乏对微血栓形成的检验及认识,笔者团队收集到的相关血栓形成的临床数据极少,无法对其进行验证。随着认识水平的提高,笔者团队发现SMPP中的血栓形成并不罕见,北京儿童医院的一项研究表明,D-二聚体质量浓度的升高,即超过11.1 mg/L或者大于5.0 mg/L已可提示体内血栓的形成[20]。Cesta等[21]提出,NETs是COVID-19免疫血栓形成的关键驱动因素,并证明通过监测NETs可以早期预测患者体内血栓的形成。因此,NETs与D-二聚体的联合可能是监测SMPP中的血栓甚至微血栓形成的新方向,希望后期随着病例数的增加可以通过开展更多的临床试验来验证这一观点。
目前,对于肺局部损伤的机制仍无明确定论。本研究结果显示,SMPP患儿患侧肺BALF中NETs的质量浓度高于健侧肺,提示NETs的过度激活可能参与了 SMPP 患儿的局部肺损伤。康妍萌等[22]的研究提示,SMPP患儿BALF中存在严重的1型与2型辅助性T细胞(T helper cell, Th)比值失衡,结合Zheng等[23]所报道的NETs参与了Th2介导信号转导和转录激活因子6(signal transducer and activator of transcription 6,STAT6)依赖性方式的补体C3高表达,提示了NETs参与介导的Th2-STAT6-C3-NETs的级联反应可能是SMPP 患儿局部肺损伤的重要致病通路。
本研究对BALF的收集严格遵循相关指南操作[6]。研究结果显示,SMPP患儿血清NETs质量浓度高于其在BALF中的质量浓度。NETs的肺外高表达表明,患者正经历的感染过程可能是一种强烈的系统性炎症反应,但肺炎支原体是否可入血形成肺炎支原体血症尚未明确,普遍的观点认为肺炎支原体感染后的肺外并发症与异常的免疫炎症反应有关,但对于异常的免疫炎症反应来源尚无定论[24-25]。SMPP患者血清NETs的高表达可能解释了这一原因,这也与其较其他社区获得性肺炎更易出现肺外并发症相符[26]。因此,监测NETs在血清与BALF中的含量,有利于临床医师对SMPP患儿全身炎症反应程度的评估以及病情严重程度的判断,但由于收集的样本量较少,本研究无法得出其与肺外并发症的关联,期望后续可以通过进一步扩大样本量,阐明NETs在SMPP肺外炎症中的作用。
本研究中,外周血NETs联合CRP、LDH检测对预测 MPP患儿疾病进展的ROC AUC为0.974,诊断效果优于NETs、CRP这些指标的单独检测,提示联合检测对预测SMPP的发生具有较高的价值,其诊断的灵敏度和特异度分别为0.923、0.950。临床医师可根据该模型对MPP患儿进行预测,对于可能发生SMPP的患儿予以早期诊断并采取积极的治疗及监测方案,以改善患儿预后。
综上所述,MPP 患儿中过度激活的 NETs可能与SMPP的发生及SMPP的局部肺损伤有关。外周血 NETs、CRP、LDH可作为MPP患儿疾病进展的预测因子,指导治疗方案的制定。